Introduction

This page contains a JavaScript that simulates Peppered moth evolution.
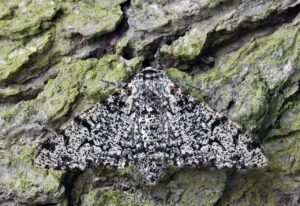
The Peppered moth (Biston betularia) is known for having a darker appearance in areas with industrial pollution where tree bark is darker because of soot. In a cleaner environment, with lighter colored tree bark, the moths have a lighter appearance. Bird predation of the moths depends on the contrast between tree bark and moth color. A higher contrast makes the moth more visible to the bird and increases its chance of being eaten.
In the simulation model, a ‘color gene’ determines the color of the moth, with 10 shades of gray, while the tree bark has a fixed color. The simulation loops through a number of generations, during which ‘predation’ takes place. Depending on the color difference between ‘tree bark’ and ‘moth’, the simulation will ‘kill’ more or fewer insects.
Each generation starts with a population of adults. The number of individuals at the start of the simulation is set by the user. The user also sets the initial color of the insects and the tree bark color. In each generation, the simulation performs the following 4 steps:
- Reproduction – Each adult insect of the start population generates a number of immature descendants. The kids get the same color gene as the parent, but in a small percentage of cases there is a mutation, which will make the adult moth a bit darker or a bit lighter.
- Random mortality of immature insects – A percentage of the immature insects (eggs, caterpillars) gets at random killed. This percentage can be set by the user between 0% and 100%. If 100% is selected, each insect will produce only 1 descendant. After this random mortality, the ones that did not get killed grow up to be adult moths.
- Predation of adult moths – This is the step where adult moths are exposed to a predatory bird. The chance that the bird will see and eat the moth depends on the color contrast between insect and bark. The predation will range from 0 to 50% or from 0 to 99%, which can be selected by the user. The relation between color contrast and percentage predation can be a straight line or a curved line. See graphs below. The user can select between 7 line shapes.
- Balancing of the population – After predation the population of adults is usually still higher than the start population. To avoid exponential growth, a number of adults will therefore be randomly ‘killed’ to bring the population back at the same level. The remaining adults then start the next generation.


These graphs show the relationship between color contrast and chance of being killed (percentage). Line #1 is a straight line. Lines #2, #3 and #4 are for situations where the bird needs a higher contrast to see the moth. Lines #5, #6 and #7 are for birds that can detect more moths even at lower contrast.
This simulation model is of course a simplification. For example the reproduction is asexual, so there is no mixing of male and female genes. You could consider all insects in the simulation to be females.
To run the simulation, enter the required settings and click the ‘Start evolution’ button. The simulation runs very fast. When finished it will display a graph showing the average color of each generation. Below the graph it will show a visual representation of how the moths of each generation contrast with the tree bark.
Click the button again for a new run of the simulation.
Note that with some settings, the population may go extinct. For example with small populations and a high initial contrast, the birds could kill all moths, before the better genes could be selected.
Tip: Hide this introduction text while running the simulations.
Settings for the simulation
